Cycling is rapidly becoming the mode of choice for health and recreational activity across several urban centres in India. However, it remains a very minor share (<2%) on a majority of corridors across the country. The health and environmental benefits of cycling are well understood and several local authorities are planning sizeable investments to improve cycling facilities within their jurisdictions. However, a question arises about how to target these investments for best returns. Many areas do not have a high cycling mode share, but might have the right mix of people and geography to make cycling an appealing option if certain steps were taken.
Developed through an internally-funded Research and Innovation project, Steer Davies Gleave's 'Cycling Potential Index' (CPI) provides an objective, evidence-based method of assessing the underlying potential for cycling in a specific location. This method of analysis can be used to help identify locations to be studied further and where it would be best to direct investment in cycling infrastructure.
Our Cycling Potential Index highlights areas that have high potential for cycling, based on demographics, topography and distance to work, but current low rates of cycling. The CPI draws on data reflecting three of the most important influences on cycling:
- Hilliness
- Socio-demographics
- Commute length
Purposefully, the CPI does not take into account the existing provision of cycle infrastructure. Instead it indicates underlying cycling potential based on geographic and demographic data available in the US and Canada, irrespective of existing policy and physical interventions.
The CPI is then compared to existing cycling rates to identify high-potential areas with low cycling. Used early in an analysis, this gives an indication of areas to be investigated further.
With the addition of local data, the CPI can help forecast the increase in the level of cycling given appropriate facilities and promotional support. This, in turn, can be used within a business case assessment to help fund cycling interventions.
The process
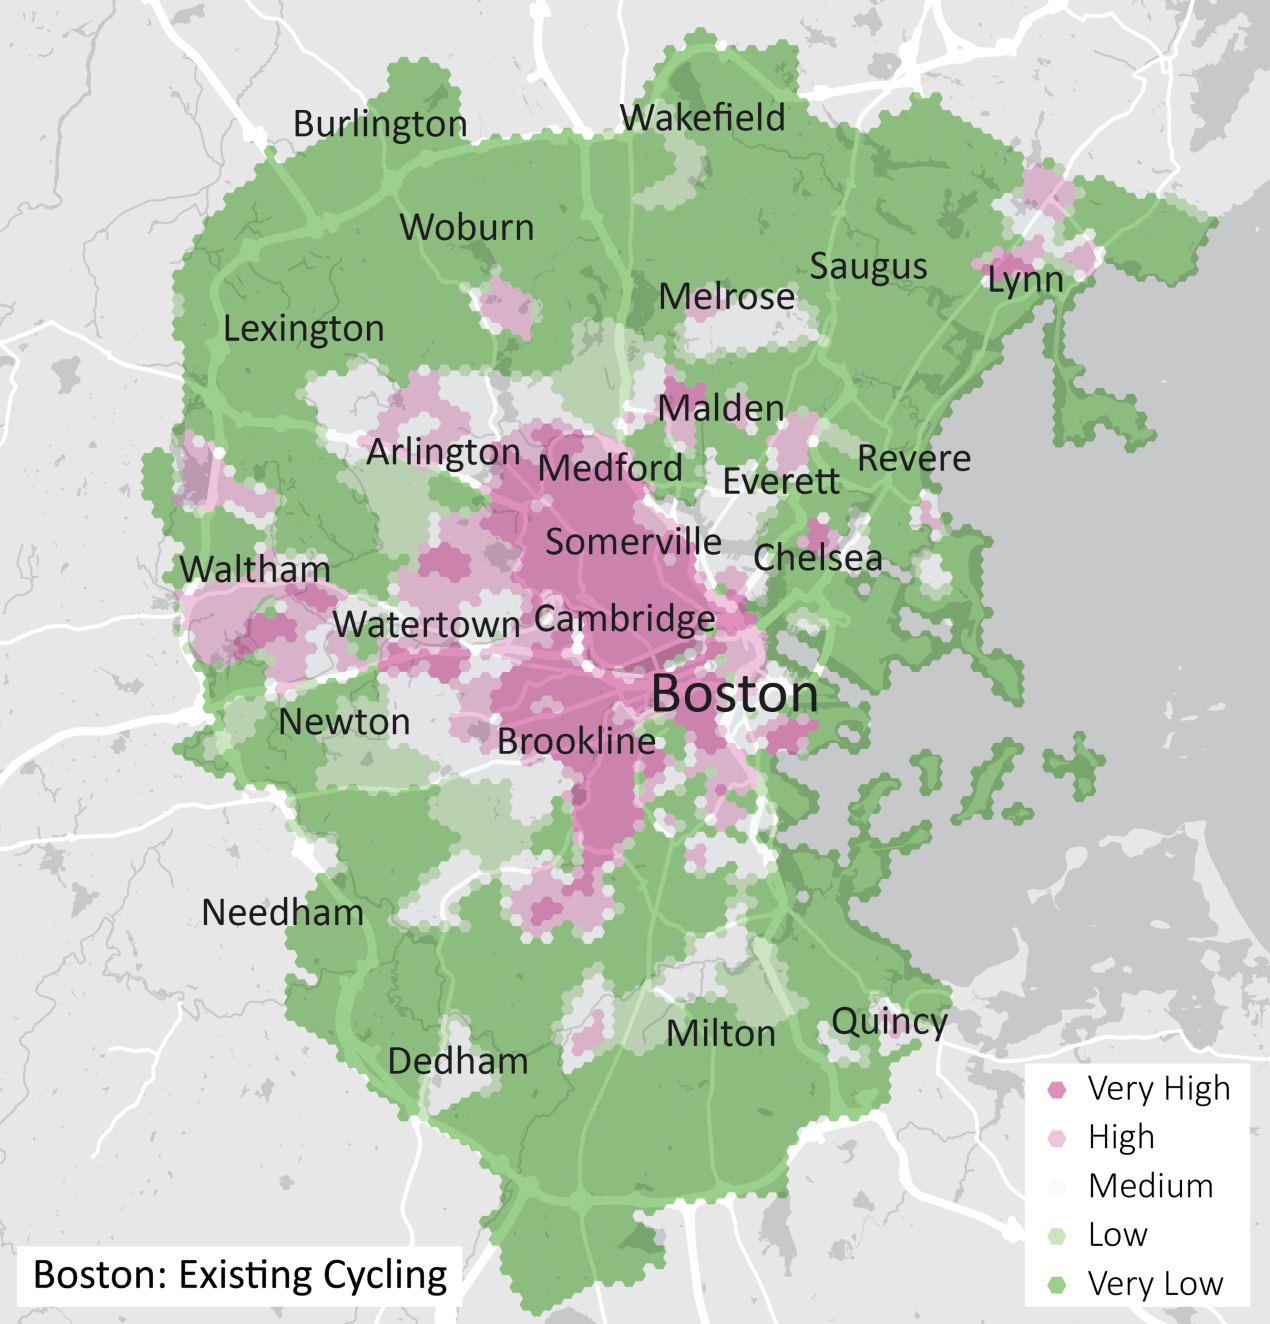
The standard CPI process produces three maps: first, the cycle potential map itself; second, an existing cycling map based on commuter cycling data; finally, a comparison of these two maps to highlight locations of high unmet potential. If available, further analysis and mapping of current cycling infrastructure quality can be used to explore priority locations for further analysis or investment.
Example: Boston, USA
Our analysis of Boston is a good example of the CPI approach when looking at cycle potential vs. actual commute cycling (see maps below). The areas marked as having the highest cycling — Cambridge, Somerville, Allston, the South End and Jamaica Plain — are not surprising as they are areas popular with students and young professionals. For instance, Cambridge is home to two of the world’s most prominent universities, Harvard University and Massachusetts Institute for Technology (MIT).
When we overlay the existing cycling and potential cycling maps to see where there may be unmet demand, we are met with some interesting patterns. Lower-income urban areas with less social capital (Roxbury, Chelsea), and suburban town centres (Lynn, Needham) are highlighted (see maps below), suggesting that it would be worth investigating these areas further to see why cycling is underused.
Our initial proof-of-concept analysis studied four cities in the United States and Canada: Boston, Denver, Toronto and Vancouver, and each city we found areas that would benefit from further analysis of its cycling. All inputs for the analysis were publicly available topography data as well as data from the US or Canadian censuses.
In India, the same assessment could be performed quickly for communities across the country where similar data is also easily accessible.
The Cycling Potential Index is one more tool in Steer Davies Gleave's toolbox to focus efficiently on areas for potential cycling growth. This is a quick and effective first step, which can be followed up by either adding more data to refine our focus, or by more thorough analysis of the causes for less-than-expected cycling rates.
