Our new Cycling Potential Index (CPI) ranks the towns and cities in England and Wales by their underlying attractiveness for cycling in terms of terrain, demographics and travel patterns. You may have already seen this index in our latest Review magazine and on our website. In this article we take a more in-depth look at how the CPI can be used to plan cycling initiatives and infrastructure.
The CPI can provide, quickly and at very low cost, initial guidance on questions such as:
- What is the optimum cycle route / network to serve this town / destination?
- How suitable is this neighbourhood for cycling initiatives?
- Where is the best place to invest in cycling, given limited resources?
- Why is this cycle route / initiative not performing to expectation?
The CPI can identify an area with good potential for cycling, in which case, it might be argued that it is relatively easy to unlock this potential. But what if somewhere isn’t so well suited to cycling and has a low CPI? This isn’t the end for cycling, it just means we need to work a bit harder to find where there is potential, or how to overcome the obstacles.
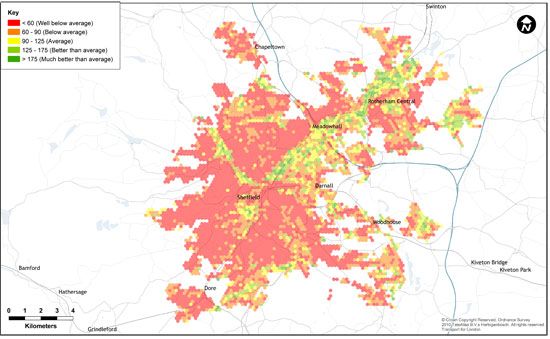
Take Sheffield as an example. Sheffield is notoriously hilly, and this is shown by its CPI which places it in the lowest quartile of metropolitan areas, largely due to the terrain dimension, on which it is the lowest of all the metropolitan areas.
Nevertheless, even here there is good potential for cycling in certain corridors, as illustrated below in Figure 1. This shows the underlying potential for cycling (using the CPI) across Sheffield, where the green and yellow areas have most potential and the red areas the least. Although large parts are not suitable for cycling (except for leisure or fitness purposes), there are some corridors which do have very good potential.
This is a fairly typical situation, in that it is rare for an entire area to be well-suited to cycling (York and Cambridge being two of the exceptions to the rule). This means that, to obtain best value from investment in cycling infrastructure, it is worth focusing on those locations most suited to cycling.
The importance of this is amplified when one considers the impact of getting it wrong: it’s not just an inefficient use of resources, it’s counter-productive in that if people see cycling facilities not being used it casts a doubt as to the whole value of investing in cycling. Conversely, the ideal situation is where momentum can be built up: people see some really good facilities in the right place being well used and this encourages more people to use them, and others to want similar investment in their area.
More detailed analysis
As well as providing quick initial guidance, CPI-based analysis can be the ideal starting point for more detailed analysis. This can involve building in locally available data (for example on travel patterns or current cycle usage), and exploring one or more of the individual dimensions (terrain, population, travel patterns) in more detail.
For example, by delving further into the population dimension, more can be learnt about the types of cyclists in an area and the kinds of measures likely to resonate with them and lead to behaviour change. Similarly, if there is locally available data on travel patterns (perhaps from a transport model or travel survey), this can be combined with the data behind the CPI to help in forecasting the potential use of cycling infrastructure, and in developing a Business Case for investment.
The CPI can therefore be considered as a tool to support a cycling strategy which, in the words of Boris Johnson, can create a ‘cycling revolution’.